For-sale housing inventory has long been a bellwether of future home prices. Historically, when there have been fewer homes for sale, prices have risen, and vice versa. With the current cycle of scarcity now in its tenth year, however, some analysts have begun to ask whether inventory levels remain relevant. We contend they do, with a tip of the hat to mortgage rates, which tend to have a market-balancing effect. Let’s look at the data.
Months Remaining Inventory (MRI)
Months Remaining Inventory (MRI) is based upon the current total supply of homes for sale relative to the recent monthly sales rate. We have shown in numerous past posts and research papers that MRI is a reliable leading indicator of price trends. This goes as far back as the mid 1980’s when we first started establishing leading indicators of the housing market.
MRI represents supply (homes for sale) and demand (sales) in one metric. At the national level we first examine the correlation between the monthly MRI and monthly calculated annualized price changes, and we get the chart shown in Exhibit 1, with data pulled from 1993 to present and provided by the National Association of REALTORS® (NAR). What we see is that there is a very strong inverse relationship between MRI and price appreciation or depreciation, with the peak at around two months MRI leading price changes. We use this two-month lead to provide the graph shown in Exhibit 3, where we can observe price trends versus MRI and the strong inverse relationship is apparent.
Exhibit 1: U.S. Existing Single Family Median Price Annual Percent Change and Months of Inventory Cross-Correlogram
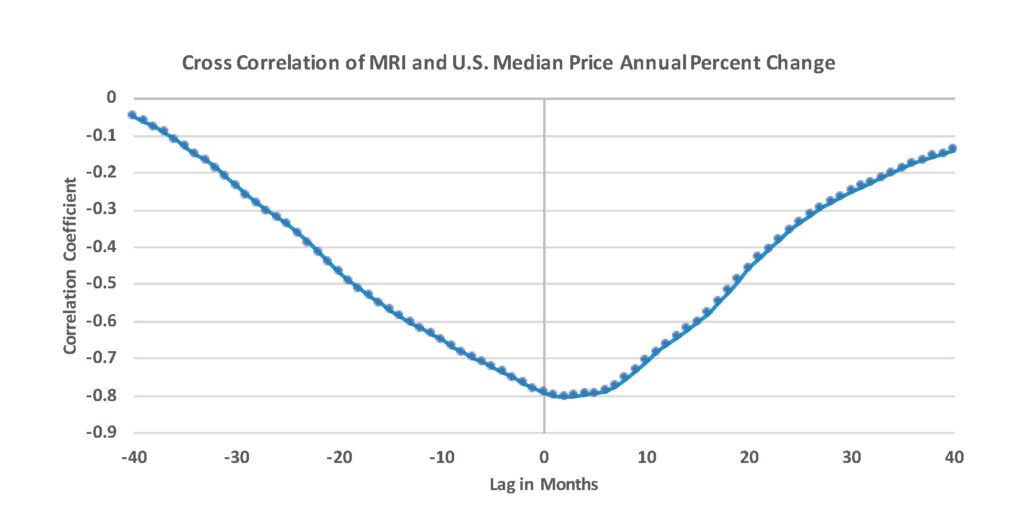
Source: National Association of REALTORS®
Exhibit 2: U.S. Existing Single Family Median Price Annual Percent Change and Months of Inventory Shifted by Two Months Since 1993
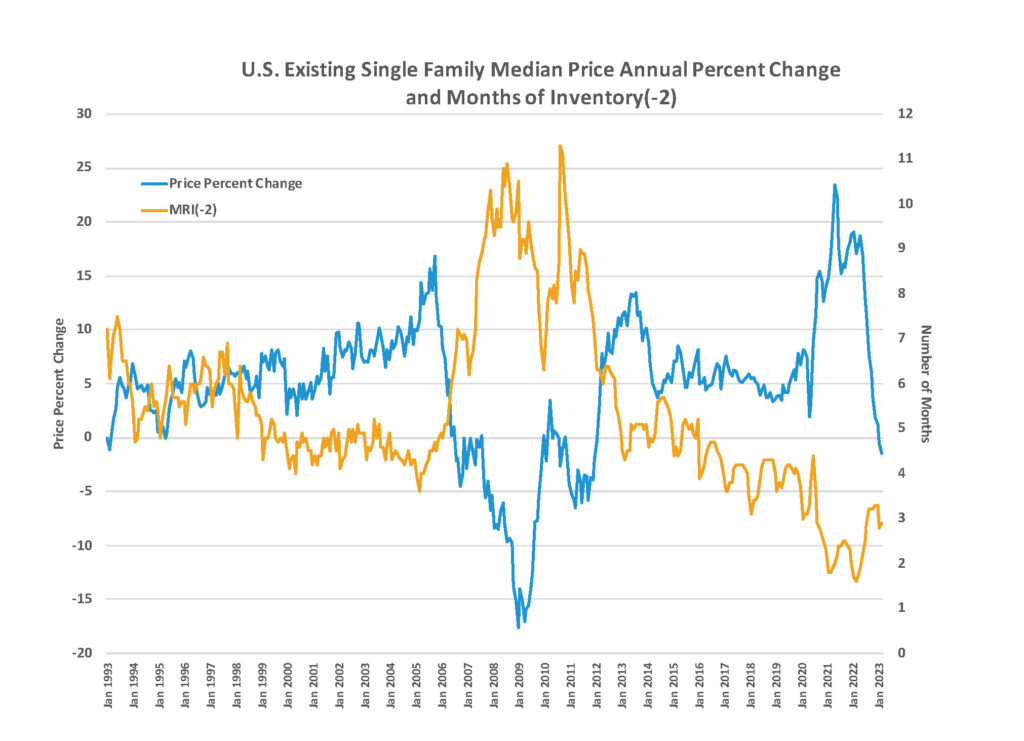
Source: National Association of REALTORS®
Next, we run a regression using data since 1993 to explain the variation of prices using only MRI with a two-month lead. This is shown in Exhibit 3. The fit is not perfect, but significant and strong. A stronger than expected downward price trend can be observed in the last year, which is where we see the balancing effect of mortgage rates.
Exhibit 3: Using MRI to Predict Home Price Trends at the National Level
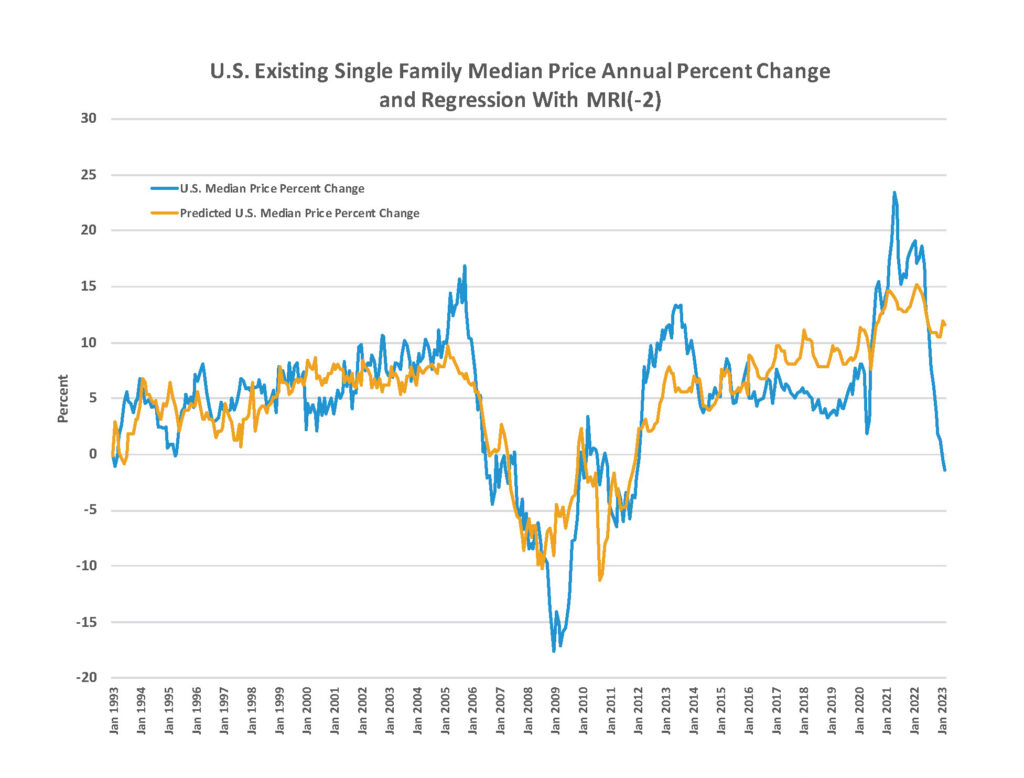
Source: National Association of REALTORS®
Offsetting Influence of Mortgage Rates
From 1991 to the present day, the average spread between the 30-year fixed-rate mortgage (FRM) over 10-year Treasurys has been 171 basis points (bps) (Exhibit 4). Currently the spread is much wider (302 bps). We also know that mortgage rates are a primary driver of affordability, and with rates at 6.39% as of May 4, according to Freddie Mac, we can infer they would be 131 bps lower – or 5.08% – if recalculated using the longer term historical average spread.
Interpreted another way, mortgage rates are currently 25.8% higher than normal relative to 10-Year Treasury Bond rates.
Exhibit 4: Highest Credit Spread in Over 30 Years
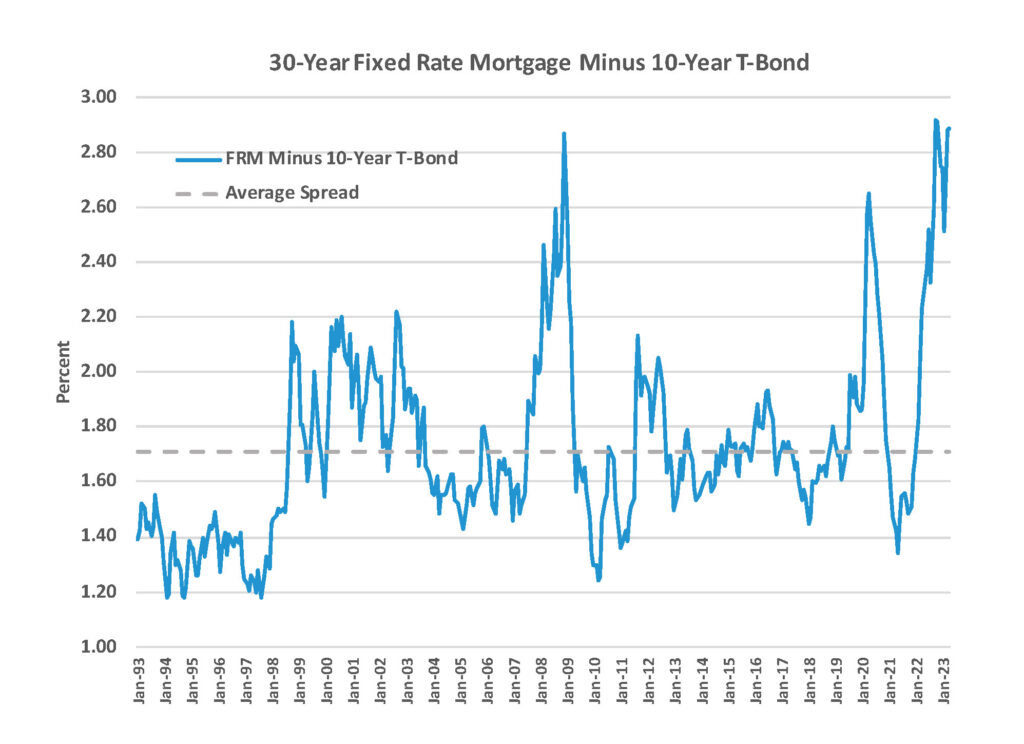
Source: Freddie Mac PMMS
There may be several plausible explanations for this. For one thing, the Federal Reserve’s balance sheet reduction efforts have had a larger impact on the value of mortgage-backed securities (MBS) relative to Treasurys, a consequence of the outsized share of newly issued MBS the Fed was buying to stimulate the economy during the COVID 19 era.
Mortgage providers may have also decided to increase risk premiums to account for potential increases in defaults, as well as increased prepayment risk of high interest rate mortgages, going forward. Still, such extra premiums would seem to suggest an expectation of mortgage defaults several times the current rates.
Whatever the reason, there is a direct and significant impact on home prices induced through the negative impact on affordability.
Case Study: California
The impact of MRI remains significant in all markets and, when low, counters the impact of higher fixed mortgage rates. The impact of interest rates on price is about one and a half times that of changes in inventory. Both are extremely important indicators of where home prices are heading.
We also need to point out that the lead of MRI to home prices is not consistent in all markets. In California CBSAs it tends to lead by about 10 months, while in Texas the lead is very modest.
The graph below, Exhibit 5, shows a relationship between inventory and changes in median prices using data from the CALIFORNIA ASSOCIATION OF REALTORS® with MRI shifted by 10 months.
Exhibit 5: Fit Between Lagged CA MRI and Price Trends
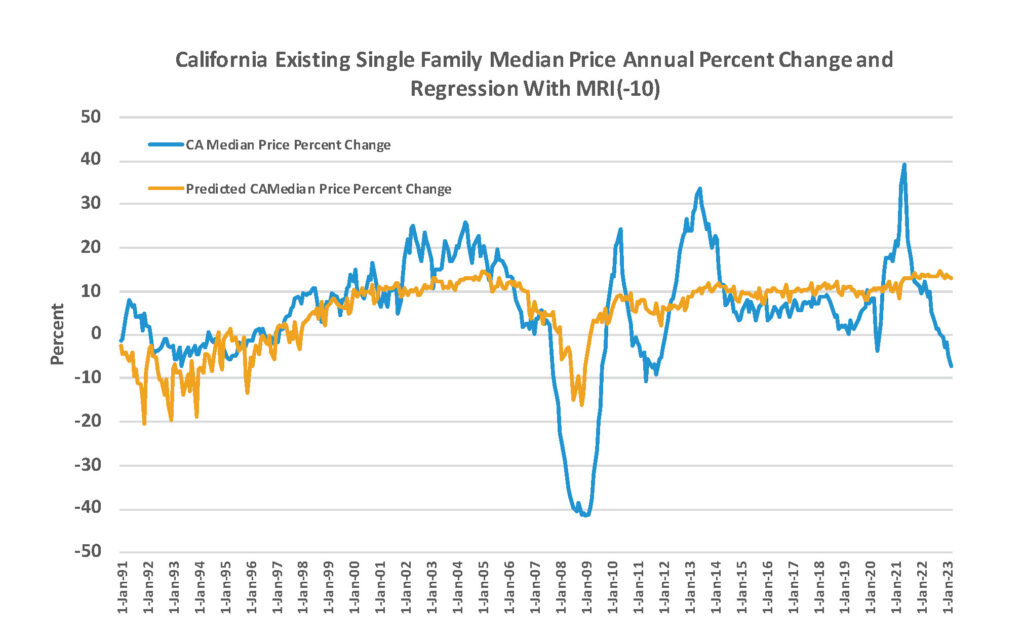
Source: CALIFORNIA ASSOCIATION OF REALTORS®
In Exhibit 6, we combine the impact of inventory and rate changes on California home prices using MRI and the fixed rate mortgage (FRM)/Treasury spread. Note we have offset MRI data by 10 months (-10) and the FRM/Treasury spread by two months (-2) to generate the predicted prices.
Exhibit 6: Predicting CA Price Trends with MRI(-10) and the FRM Spread(-2)
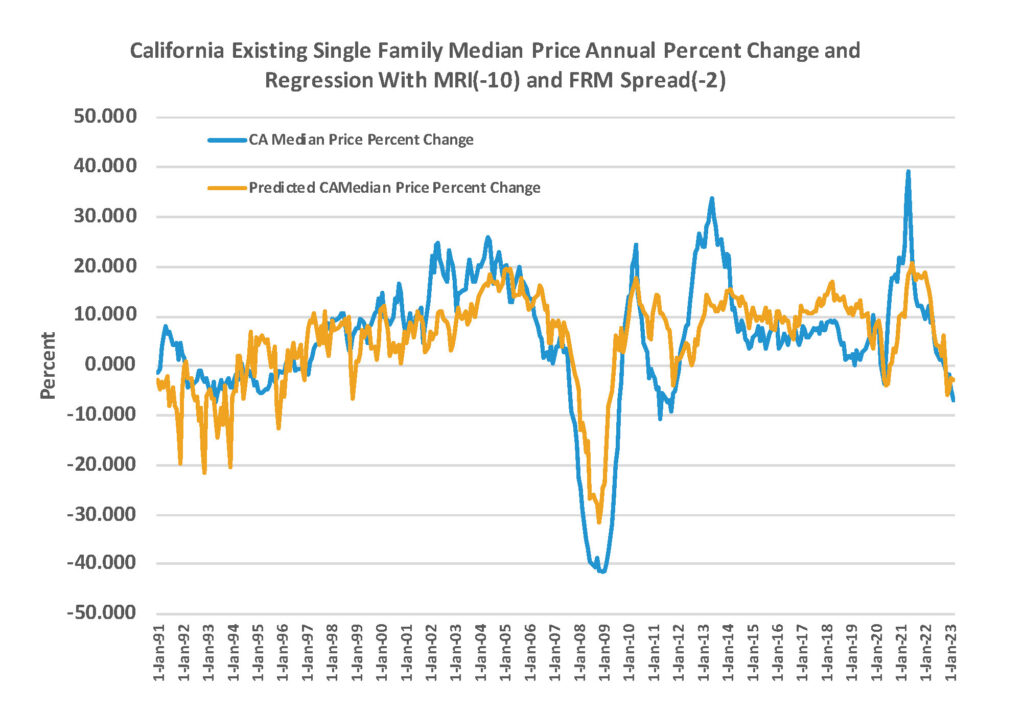
Source: CALIFORNIA ASSOCIATION OF REALTORS®
Since MRI is increasing at present in some markets, it does suggest some softening of prices. At the same time, if FRM rates return to more normalized levels we would see the negative impact of rising MRI more than offset by lower mortgage rates.
Conclusions
We note a general decline in the average MRI over the past decade, perhaps because markets are becoming more efficient, but primarily because supply has not kept up with increasing demand. In the most recent year, we can also attribute the decline in inventory to potential sellers sitting on significantly below market mortgage rates.
During COVID, with concerns of a pending recession, numerous stimulatory policies were enacted, including providing mortgages that were often less than inflation. Essentially such loans were provided at negative real rates and continue to be at negative real rates. Thus, few homeowners will want to give up such mortgages until some non-financial life cycle event requires them to sell.
Today, nearly two-thirds of all borrowers have mortgage rates at or below 4%, and to consider a shift to something in the 6%-plus range does not make sense if it can be avoided. This is why home sales volume is down and will remain at low levels, awaiting more normalized and lower mortgage rates.
It also appears that state or local markets home prices remain fairly predictable when considering both the trends in the MRI and the FRM Spread. However, the expected lead times vary by market and require localized analysis for the best results. In some markets, like those in California, prices may have already adjusted to reflect both interest rates and inventory levels, as may several markets in the Northeast.
In conclusion, inventory still matters as do mortgage rates. We note that mortgage rates are running far above historical spread levels as the market seeks a new equilibrium over the next year or so. Many potential buyers and sellers are sitting on the sidelines in hopes of lower mortgage rates in the not-too-distant future. In the interim, these offsetting factors – interest rates and inventory – will continue to keep the housing market in a holding pattern.