If you ask a housing expert “how long will it take to sell my home?” a fully informed answer would normally start with these questions:
- “What time of year are you selling or when are you listing the home for sale?”
- “What is the size or price range of your home relative to others in the market?”
- “How close to market value will you list your home for sale?”
These are not, however, normal times. In the current market, a better answer would have to include some analysis on both inventory levels and interest rate trends.
With interest rates more than double what they were just a couple of years ago and traditional measures of affordability near a record low, homes should be taking longer to sell – all the more so as we head into seasonally slower home sales from July through February. For-sale inventory is also at a historic low, however, and that offsetting factor has given the current home sales market the “appearance” of normalcy, even though, when you scratch the surface, conditions are anything but.
In our Market Blog last December, we outlined the indicators we use to define the condition of the overall U.S. market as well as its individual sub-markets down to the neighborhood level. One of the most important is median or mean sold market time, better known as Days on Market (DOM), the number of days between the day a home is listed for sale and day the home is sold.
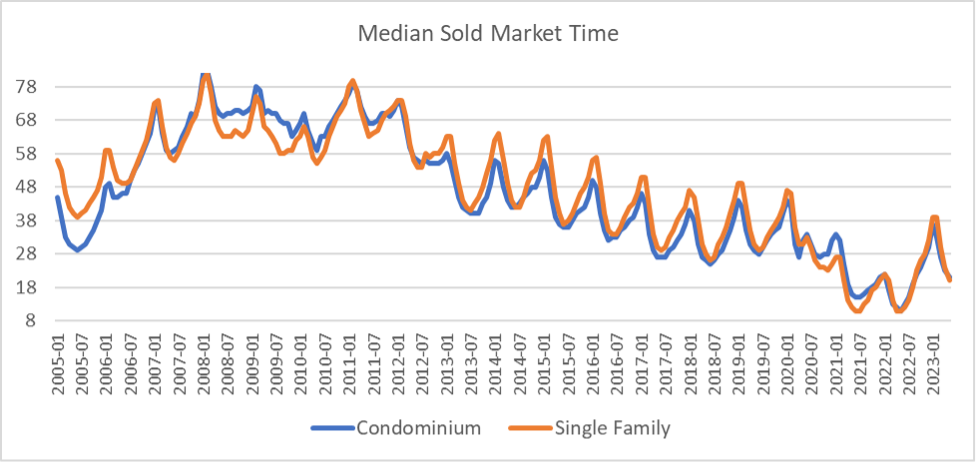
This is a countercyclical indicator, low in strong markets and high in weak ones. As seen in Exhibit 1 which shows median Sold Market Times for overall U.S. single family homes and condominiums, sold market times have increased in the past year to more normal levels. While the DOM is typically reported as a single number, there are multiple dimensions. In this post we focus primarily on interest rates and inventory.
Exhibit 1: U.S. Existing Median Sold Market Time (Number of Days)
Nine out of ten U.S. homeowners with mortgages have rates far below current offerings, creating a substantial disincentive to sell and then try to buy a new home in a much more expensive market. This dynamic has dramatically reduced the number of homes available for sale and resulted in anemic inventory levels, measured by months of remaining inventory.
Low inventories suggest reasonably priced homes will sell fairly quickly, as long as they are not too far out of reach for the average buyer.
The shortage of existing homes for sale has resulted in increased market share for new homes. Typically, new homes make up between 10% and 15% of all homes for sale. Currently they account for between 25% and 30%.
With affordability near record lows, most buyers are constrained by higher mortgage rates. Some will adapt by settling for a lower-priced home. Others will wait, hoping for mortgage rates to come down to levels more typical of the past decade.
Is it rational to wait for lower rates? Mortgage spreads over the 10-year Treasury bond are unusually high, so it may be reasonable to wait a year or so, if one has some flexibility on purchase timing. Under such a scenario, when mortgage rates drop below, say, 6%, buyers and sellers who accept this as “normal,” may return to the market.
At present, however, inventories remain low and rather than steep price declines, we are mostly witnessing thinly traded markets, likely driven by buyers and sellers with a compelling need to buy or sell for non-financial reasons. We expect this thin market to continue for at least the balance of 2023 and into 2024. Reasonably priced lower-price-tier homes will continue to sell fast and the lack of inventory is propping prices up for now.
A recession would change this, but it remains uncertain when, or if, such a recession might occur. High labor demand and numerous labor disputes suggest we are not yet out of the woods in fighting inflation, and any further increases in rates will certainly not do housing any favors.
Characteristics of a “Normal” Housing Market
There is a distribution of active buyers for any given house. Each buyer has their own reservation price (the highest price they are willing to pay). Buyers who need to find a home quickly will tend to be at the higher end of the distribution, while buyers satisfied with their current home may be less motivated and therefore near the bottom. The total number of buyers in the market varies over time with changes in the job market, demographic trends, and mortgage rates.
There is a similar distribution of sellers in the market, at any one time, with similar and substitutable property. Properties need not be identical to compete, but merely reasonable substitutes. Sellers who need to sell will be at the lower end of the distribution, pricing closer to actual median market value or even below in some cases. Sellers with less incentive to sell will tend to be more motivated by price and therefore remain near the top.
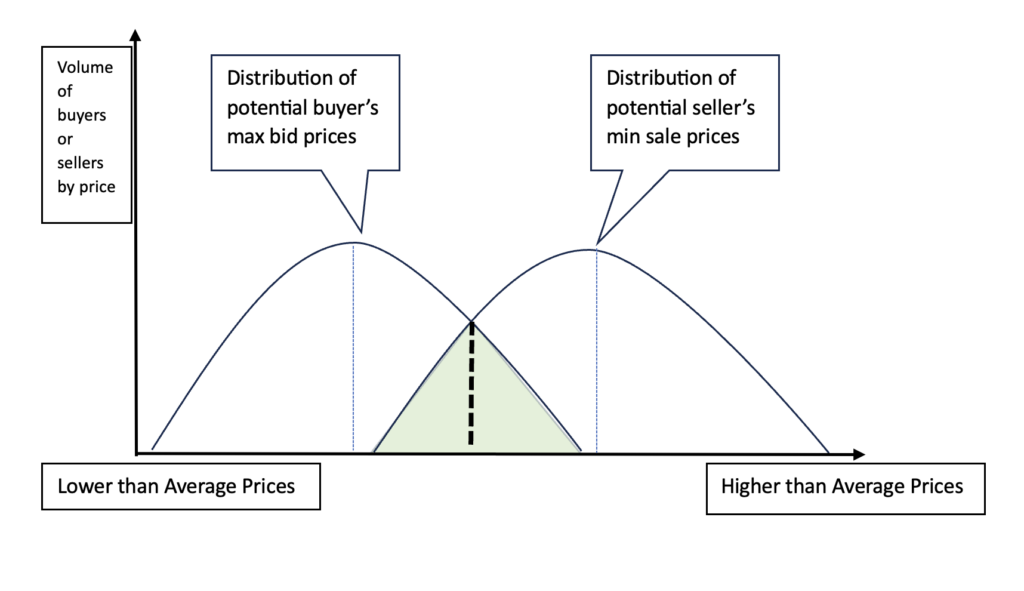
Affordability, motivation, information obtained by research on listing services and from agents, tastes and preferences will all play a role in forming these reservation prices. We depict a normal market below, with fair market value defined as the most probable price with normal time on the market and typically motivated buyers and sellers.
In Exhibit 2 below, the shaded area is the region where transactions are likely with the most probable price (market value) under the thicker dashed line. The dashed line under the buyer’s distribution can be thought of as the average bid while the dashed line under the average seller can be thought of as the average acceptable selling price. This is not exactly the same theoretical figure that we have in Exhibit 1 in that we do not know buyer’s reservation prices, but it does include much of the seller’s distribution and all of the overlap where sales actually occurred. While price per square foot controls for the impact of size on price, it does not control for quality so we should be careful about suggesting the gap between the peaks as anything more than a rough indication of the spread between buyers and sellers.
Exhibit 2: Theoretical Distribution of Buyers and Sellers Reservation Prices for a Similar Home
The distributions above will shift over time. That is, when interest rates are falling, and housing becomes more affordable, the buyer distribution shifts right just as the volume increases.
Sellers typically fix an asking price at the start of a listing for sale and seldom change it upwards, so in the short run prices will quickly increase when interest rates decline as buyers become price takers and their reservation prices exceed list prices. As other sellers observe the upward price trends, they may also enter the market slowing down the price trend and stabilizing prices over time.
If a seller does not receive any offers within their own timing constraints, they will typically lower the asking price, moving to the left of the distribution. Some homes will fail to sell during the initial listing period and sellers will remove them from the market. Similarly, some buyers will leave the market after failing to find a home that meets their needs at a suitable price. That is why the distribution of potential buyers and sellers above is larger than the actual observed transaction distribution.
In the current market, with an unusually large number of would-be buyers and sellers on the sidelines, the remaining marketplace continues to exhibit the characteristics of a “normal,” albeit much smaller, market, with familiar DOM performance – thus the phenomenon of rising prices despite rising rates and falling demand.
This “Normal” is Not Normal
Mortgage rate increases typically have an immediate negative impact on real estate prices, as they reduce affordability, and by extension, demand. I say typically, because that’s what would be expected to happen with a “normal” three-to-six-month supply of houses for sale.
As of mid-2023, however, inventory levels in many U.S. markets are at three months or less and could easily remain low for the next several quarters. A lack of willing sellers is keeping supply down and prices higher than one would expect with the fixed mortgage rates hovering around 7%. We discussed this topic in depth in a blog this past May. See Why Home Prices Are High, Even With Falling Demand | Black Knight® (blackknightinc.com).
As I said, there are a lot of other factors that contribute to home prices, but these are the two currently driving the market. We will continue to monitor all of the relevant data and check in from time to time to share our observations and insights.